Ask a room of traders which month is best for UK equities and you will get a confident answer. Ask them to show you the data, split it in half and account for dealing costs, and the room tends to go quiet. Seasonal patterns in the FTSE 100 are real enough to be interesting and slippery enough to ruin an otherwise sensible process. The trick is knowing which ones have a reason to exist, and how to test them without convincing yourself of something that isn't there.
Why the UK calendar isn't the US calendar
Most of what circulates as "seasonality" started life in American research. The classic January effect describes small-cap shares outperforming in the first weeks of the year, driven by investors selling losers in December to realise tax losses and then buying back in January. In the United States, the tax year and the calendar year are the same, so the story hangs together.
In the UK they are not. Our tax year runs from 6 April to 5 April, which means the selling-for-tax-purposes behaviour that supposedly drives the January effect should show up in March and early April instead. The pattern has also weakened considerably in the US since the 1980s as markets became cheaper to trade and tax rules changed. Treat the January effect as a piece of market history rather than a live edge in the FTSE 100.
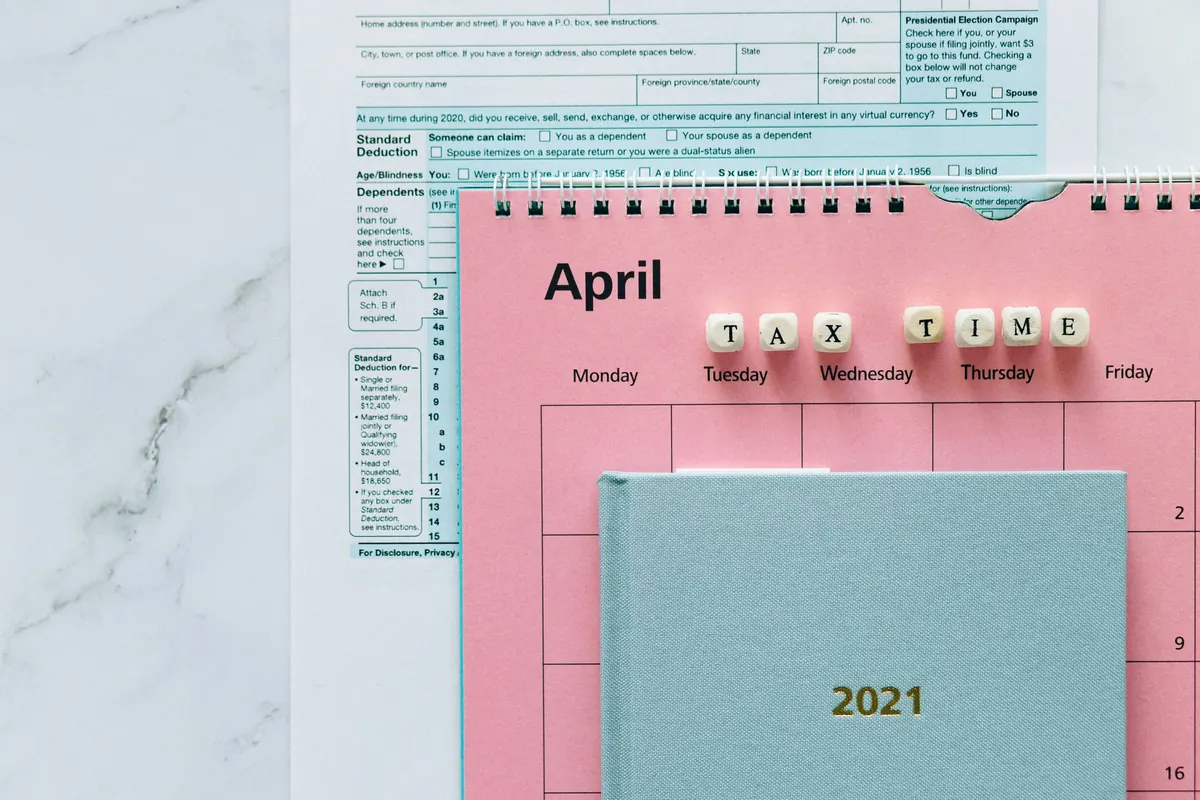
The tax-year effect: April, not January
The UK version is more about flows than about small caps. March is when investors use up remaining ISA allowances, top up pensions and realise gains or losses before the tax year closes. April is when fresh allowances arrive and money that was raised in February and March often goes back to work.
What the flows actually look like
- Late March: a rush to use the ISA subscription before the deadline, plus pension contributions timed against the annual allowance.
- Early April: new allowances, fresh contributions, and a tendency for fund managers to report inflows in the first weeks of the new tax year.
- Loss harvesting: selling holdings sitting below cost before 5 April to offset gains, which can weigh on individual names rather than the index as a whole.
- Rebalancing: some managers tidy portfolios before the year end, which can appear in the data as pressure on the previous year's winners.
None of this guarantees a direction for the FTSE 100. It does mean that the weeks around the tax-year boundary behave differently from the average week, and that is the kind of thing you can actually test.
Other patterns worth knowing
Several other tendencies do the rounds. Some have a plausible mechanism; others are fishing expeditions dressed up as analysis.
- May to October. The old "sell in May" rule reflects the fact that the November-to-April stretch has historically outpaced the summer half in many markets, including the UK. The mechanism is weak, the effect is unstable across decades, and it has failed for long stretches.
- The Santa rally. A handful of strong days around Christmas and the New Year, often attributed to thin volumes and window dressing. Statistically noisy because it covers so few trading days.
- September. Frequently cited as the weakest month. Worth checking against the median rather than the mean, because a single bad September can drag the average a long way.
- Expiry and review dates. Monthly futures and options expiry falls on the third Friday, with the quarterly contracts in March, June, September and December drawing far more activity. Index reviews are also quarterly, and index changes take effect around the same point in the month.
- Dividend season. The FTSE 100 price index drops mechanically when a constituent goes ex-dividend. Because the largest firms pay at clustered points in the year, certain weeks look weak for no reason other than cash leaving the index. Use a total-return series or you will misread it.
How to test a seasonal claim without fooling yourself
This is where most seasonal analysis falls apart. A short, disciplined process beats a clever one.
- Write the rule down first. "Buy the close of the last trading day in March, sell the close of the tenth trading day in April" is a testable rule. "April feels strong" is not.
- Demand a reason. Tax deadlines, allowance resets, fund flow cycles and index events are mechanisms. "The market likes spring" is not.
- Use the longest clean series you can. The FTSE 100 only began in 1984, which gives you roughly forty years. Monthly observations mean a few hundred data points at best, and one unusual year can dominate the result.
- Benchmark against the average month, not zero. UK equities have historically drifted higher over time, so a window that rises most years is not automatically special.
- Look at the median and the hit rate, not just the mean. If a pattern holds in twelve of forty years, it is a curiosity. If it holds in thirty of forty with a sensible spread, it deserves attention.
- Split the sample. Test the first half and the second half separately. A pattern that only exists in the earlier period has probably been arbitraged away.
- Ask how many things you tried. Test twenty patterns across twelve months and something will look brilliant by luck alone. Be sceptical of the best result in a large search.
Costs, small samples and the overfitting trap
Stamp duty reserve tax of 0.5% applies to purchases of most UK-incorporated shares, and you pay the spread on both sides. Dealing commissions, platform fees and any financing costs on leveraged positions sit on top. A seasonal window promising a couple of percent gross can easily turn into nothing after costs, and a pattern that needs frequent switching is the worst offender.
Be equally careful with execution. If the trade only works when you buy at the exact close on a specific Friday, it probably isn't tradable in any practical sense. Widen the entry and exit by a day or two and see whether the edge survives. If it evaporates, you were measuring noise.
Finally, remember that seasonality is a tilt, not a system. It says something about the distribution of returns in a window, not what will happen this year. Position sizes should reflect that, and any decision involving your tax position is worth discussing with a qualified adviser.
A practical way to use this
Keep a short list of seasonal effects you can explain in one sentence each, and note the dates they cover. Before you act on one, check three things: does it still appear in the most recent decade, would it survive after stamp duty and spreads, and does it fit with what you already think about valuation and momentum? If a pattern needs a chart stretched to breaking point to persuade you, leave it. The best use of UK seasonality is as a reason to look more carefully at a particular week, not as a reason to abandon your process for it.
Photo: Leeloo The First / Pexels